INP Is on Borrowed Time: Building Performance Dashboards That Outlive Google's Metric Shuffle
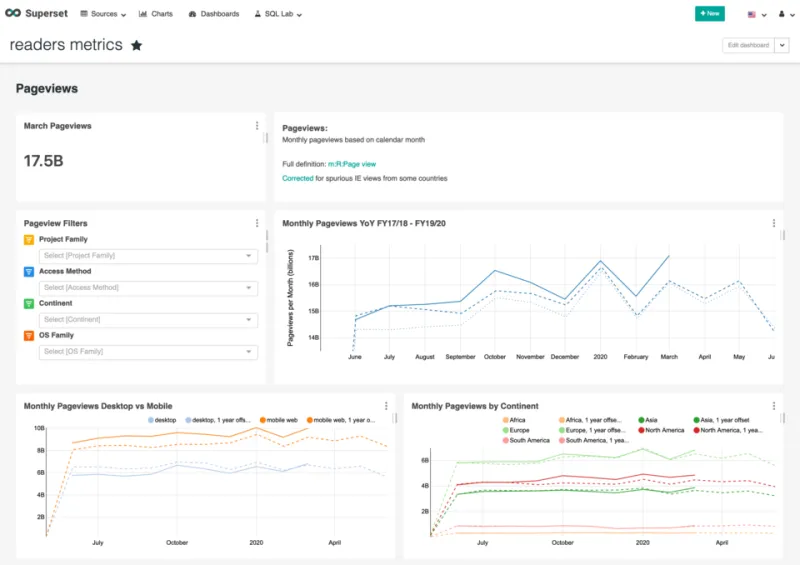
Photo: MPopov (WMF), CC BY-SA 4.0, via Wikimedia Commons
When Google retired First Input Delay in favor of Interaction to Next Paint in March 2024, a remarkable amount of performance tooling broke — not because the underlying data changed, but because dashboards, alert thresholds, and executive KPIs had been welded to a single metric name. Now that the same fate will eventually find INP, the lesson deserves a second look: metric churn is a feature of Core Web Vitals, not a bug. Build accordingly.
Why Google Keeps Renaming Things
The Core Web Vitals program has always been a compromise between measurement precision and communicate-ability. Google needs three numbers a marketing VP can put on a slide, but browser reality is messier than any three metrics can capture. FID measured only the delay before input handling; INP broadened the lens to the full interaction-to-paint lifecycle across all interactions. Each replacement reflects a better understanding of what users actually experience — and each one invalidates someone's carefully tuned dashboard.
The pattern is predictable. A metric ships as an experimental signal, gets promoted to a Core Web Vital, accumulates years of threshold baggage, and is eventually replaced by something that measures the same user frustration more faithfully. Assume the metric you're watching today has a shelf life.
What to Track Right Now
None of this means ignoring current guidance. As of today, the operative thresholds for field data at the 75th percentile remain:
- LCP (Largest Contentful Paint): 2.5 seconds or better
- INP (Interaction to Next Paint): 200 milliseconds or better
- CLS (Cumulative Layout Shift): 0.1 or better
INP's 200ms bar is genuinely demanding — it leaves roughly one frame budget for input processing, framework updates, and paint combined. Sites built on heavy client-side JavaScript routinely miss it on mid-tier Android hardware, which describes a meaningful share of US mobile traffic. If you're not already collecting INP at the interaction level (which specific element, which event handler), start now; aggregate scores hide the worst offenders.
But treat those thresholds as current guidance, not permanent law. What has stayed stable across every metric change is the category: loading, interactivity, visual stability. Google reshuffles the yardstick, not the yard.
Build for the Category, Not the Metric
Here is the practical shift: instrument your stack so the raw signals outlive the named metrics.
Collect event-level timing data. Use the Event Timing API and long task instrumentation to record what happens between user input and the next paint. INP is one particular aggregation of this data; a future metric will be another. If you own the raw event timings, re-aggregating to a new formula is a query, not a re-instrumentation project.
Store field data separately from lab data. Chrome User Experience Report (CrUX) gives you the official field numbers, but only at coarse granularity and on a delay. Your own RUM (real-user monitoring) — via web-vitals JavaScript or a commercial RUM vendor — is the only source that lets you slice by page template, device class, and geography. When the metric definition changes, historical RUM data lets you recalculate trends retroactively. CrUX history cannot.
Dashboards should show distributions, not averages. A single INP score is a summary of a distribution that's usually long-tailed. Plot p75, p90, and p99 for latency and interaction data. When the next metric swap arrives, a distribution dashboard needs a label change; an average-based one needs a rebuild.
Alert on regressions, not thresholds alone. A threshold alert fires when you cross 200ms. A regression alert fires when your p75 interaction latency jumps 40 percent week over week — regardless of what metric name the industry is using that quarter. Regression detection is metric-agnostic by construction.
The Skeptic's View
It's fair to ask whether Google's metric churn is churn at all, or just honest iteration. Both, probably. The INP replacement genuinely improved measurement; the renaming itself, however, created real costs for thousands of teams that now had to re-baseline reports, update stakeholder decks, and re-explain "good" scores that hadn't actually changed. Webmasters who treat Core Web Vitals as a moving target — monitoring the underlying user-experience signals directly — absorb these transitions in an afternoon. Those who built their entire performance culture on three metric names start over.
The Durable Monitoring Stack
A performance stack that survives metric changes looks like this:
- RUM collection at the event level, deployed site-wide, with data retained for at least two years.
- CrUX tracked as a sanity check, confirming your field data and Google's roughly agree.
- Lab testing (Lighthouse, WebPageTest) on a fixed device profile, for debugging rather than scoring.
- Alerting on distribution shifts and template-level regressions, not on any single named metric.
The next time Search Central announces that INP is being succeeded by something with a new acronym, that stack requires a dashboard label update and a blog post. Your competitors may need a quarter.